Analysis Fields and Layout
Once you have selected a data set to work with in the left column of the Analysis tab screen, the next step is to select which data fields you want as rows and columns, as well as the type of record count values to appear in the grid area cells. A default set of field selections for displaying the data set you are working with has already been setup to get you started, but it is very easy to make modifications to customize these to match your objectives. Actually, a few different data field combinations are listed under each data set type to demonstrate some layouts you might find useful. Any of these layouts can be easily customized to match your desires and objectives. Once you modify a layout it will continue to show your modified version the next time you use it.
This topic will explore how you use and manage the various data fields you want to include in your analysis. The possible combinations of fields and filtering are endless, which is what makes this grid a highly interactive and powerful analysis tool.
Managing Your Grid Layouts
 Managing the data fields in the pivot grid
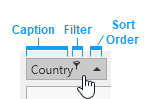
![]() An interactive grid showing various record counts for user defined set of rows and columns. is the core function in controlling the overall grid layout. Each data field from the data set you have selected is represented by a field header, as show to the right. The name of the field is shown, as well as current sort order. When you hover the cursor over a field header, the filter icon will also appear. Filtering will be discussed later in a separate topic.
An interactive grid showing various record counts for user defined set of rows and columns. is the core function in controlling the overall grid layout. Each data field from the data set you have selected is represented by a field header, as show to the right. The name of the field is shown, as well as current sort order. When you hover the cursor over a field header, the filter icon will also appear. Filtering will be discussed later in a separate topic.
Field Areas
Field headers are organized into various groups on the Analysis screen, which determine how they will be applied. You can simply drag most field headers from one area to another to modify the resulting grid layout. There are 4 such field areas on the screen:
-
Data Fields - The type of record count(s) you want displayed in the grid. The names of these always begin with "#." Available fields of this type vary depending on the data set currently chosen. For example, this includes the count of Subjects
 Subjects are the objects you are gathering information about such as people, buildings, ships, etc. In most cases within Clooz, the Subject will be a person. However, Clooz supports several other Subject types such as businesses, real estate/buildings, ships and artifacts., count of Information Records Information Records in Clooz hold the content information coming from a document or another source. The Information Record differs from a Source record which contains most of the citation information that describes the document or the Repository record that is referring to the facility or an online service where the document was found., count of Events, and count of family groups.
 -
Row Fields - The fields you select as rows will have their values displayed as row headers in a hierarchical manner based on the order of the selected fields.
-
Column Fields - The fields you select as columns will have their values displayed in column headers in a hierarchical manner based on the order of the selected fields. Most of the default layouts are either based on the Information Record location (a Country, State, County, etc. type of hierarchy), or a time frame based hierarchy (Century, 50-year, Decade, Info Rec Year).
-
Filter Fields - Other fields made visible to use as additional record filters. Any of the fields in any area can be used for filtering, but these fields in the Filter area permit you to apply filtering without having to display the field as a row or column.
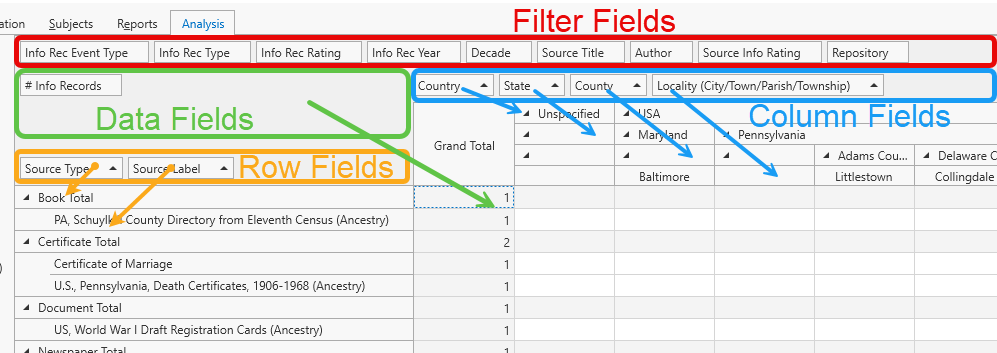
You can easily reorganize the fields appearing in each field area grouping by dragging the field header within the group (to change the order of hierarchy) or from one group to another. For instance, drag field headers from the Column Fields area to the Filter Fields area, and vice-verse. Note that the exception to that are the Data Fields which always between with "#." That requires use of the Field List.
You might note that in the above image some of the column headers show blank fields. This is how data is grouped when the record had no value for that particular field (such as the State or County fields being left blank in one or more Information Records).
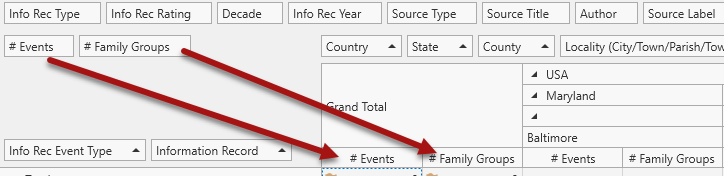 If more than one field (#) has been added to the Data Fields area, an additional row of column headers will be displayed in the grid to identify those fields. If the Data Fields area only contains one # field, no column header for it will be displayed since it would apply to every column.
Field List
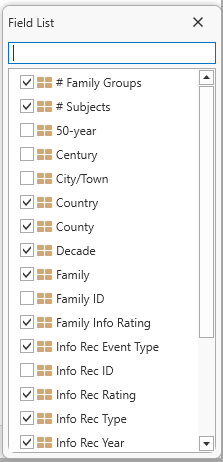 Additional hidden fields are accessible through the Field List function. The Field List is a list of all of the available fields within the data set you have chosen to work with.
This popup list can be accessed by clicking the Field List button in the lower part of the control panel on the left side of the screen, or by right-clicking any field header.
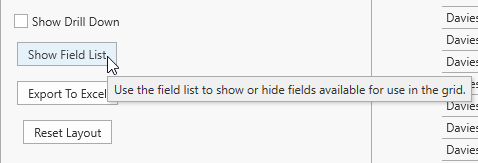
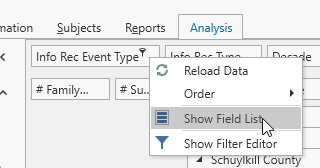
When you check a field item in the list, the field header will appear in the Filter Area of the Analysis screen. If you uncheck a field, it will be removed from the Analysis screen (regardless of the field area in which it is positioned) and maintained as a hidden field in the field list. Use this function to reduce clutter on your Analysis screen by hiding fields you don't expect to use, or bring fields that you want to use out of hidden status.
Important Note: While you can easily drag most field headers between the various groupings on the Analysis screen, this does not apply to the Data Fields. Data Fields can only be those fields that begin with the character "#." Likewise, "#" fields can only be used in the Data Fields area. To change the selection of field in the Data Fields area you must use the Field List function to check or uncheck the desired fields. Fields within the Data Fields area can be reordered by dragging to the desired order position.
Adding and Removing User-Defined Layouts
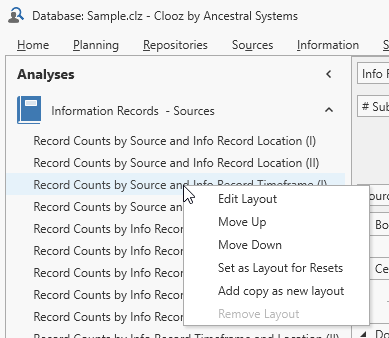 You can add your own layout configuration to the list of layouts by first selecting an existing layout that you wish to serve as the starting point for further customization. It must be within the same data set group as what you want the new layout to use. Right-click this layout, and select Add copy as new layout from the context menu that pops up. You can then proceed to further customize the name and position of the layout in the list, and configure the layout of the grid with the rows and columns you want.
Layouts that you add (not one of the original layouts included in Clooz) can be removed using the Remove Layout function in the context menu.
Renaming and Reordering Layouts
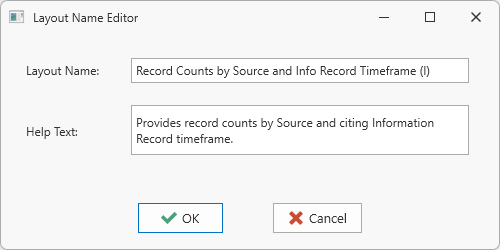 To rename a given layout, right-click the layout and select Edit Layout from the context menu. You can then change the name or text hint that appears for the layout.
You can control the position of the layout in the list by moving it up or down using the commands in the item's context menu.
Resetting Layouts
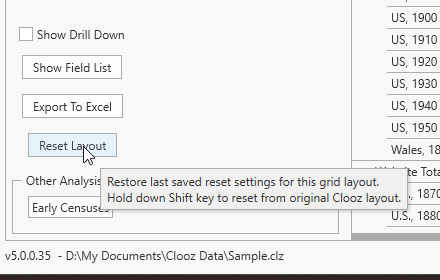 If you need to reset the layout for a particular data set arrangement, select the arrangement you want to reset in the left panel and then click on the Reset Layout button in the lower left area of the screen. The layout will return to the last configuration you saved, or the default configuration built into Clooz if you never saved any changes to it. To force the original Clooz layout to be restored, hold down the shift key while clicking the Reset Layout button.
You can save any layout you have modified using the Set as Layout for Resets menu item in the context menu for a particular layout.