Analysis Pivot Grid
The Analysis Pivot Grid![]() An interactive grid showing various record counts for user defined set of rows and columns. tool provides a powerful and intuitive interface for you to display, organize, and analyze various combinations of the Sources
An interactive grid showing various record counts for user defined set of rows and columns. tool provides a powerful and intuitive interface for you to display, organize, and analyze various combinations of the Sources![]() A Source record in Clooz should be viewed as the higher-level component of one or more source citations. Source citation details are usually included in the citing Information Record., Information Records
A Source record in Clooz should be viewed as the higher-level component of one or more source citations. Source citation details are usually included in the citing Information Record., Information Records![]() Information Records in Clooz hold the content information coming from a document or another source. The Information Record differs from a Source record which contains most of the citation information that describes the document or the Repository record that is referring to the facility or an online service where the document was found., events and family groups entered into Clooz. The pivot grid offers dynamic filtering, sorting, grouping and summarization capabilities to help you easily uncover patterns and insight into your data. Look for migration patterns or assess the coverage of your research in various locations or time frames. The possibilities are endless.
Information Records in Clooz hold the content information coming from a document or another source. The Information Record differs from a Source record which contains most of the citation information that describes the document or the Repository record that is referring to the facility or an online service where the document was found., events and family groups entered into Clooz. The pivot grid offers dynamic filtering, sorting, grouping and summarization capabilities to help you easily uncover patterns and insight into your data. Look for migration patterns or assess the coverage of your research in various locations or time frames. The possibilities are endless.
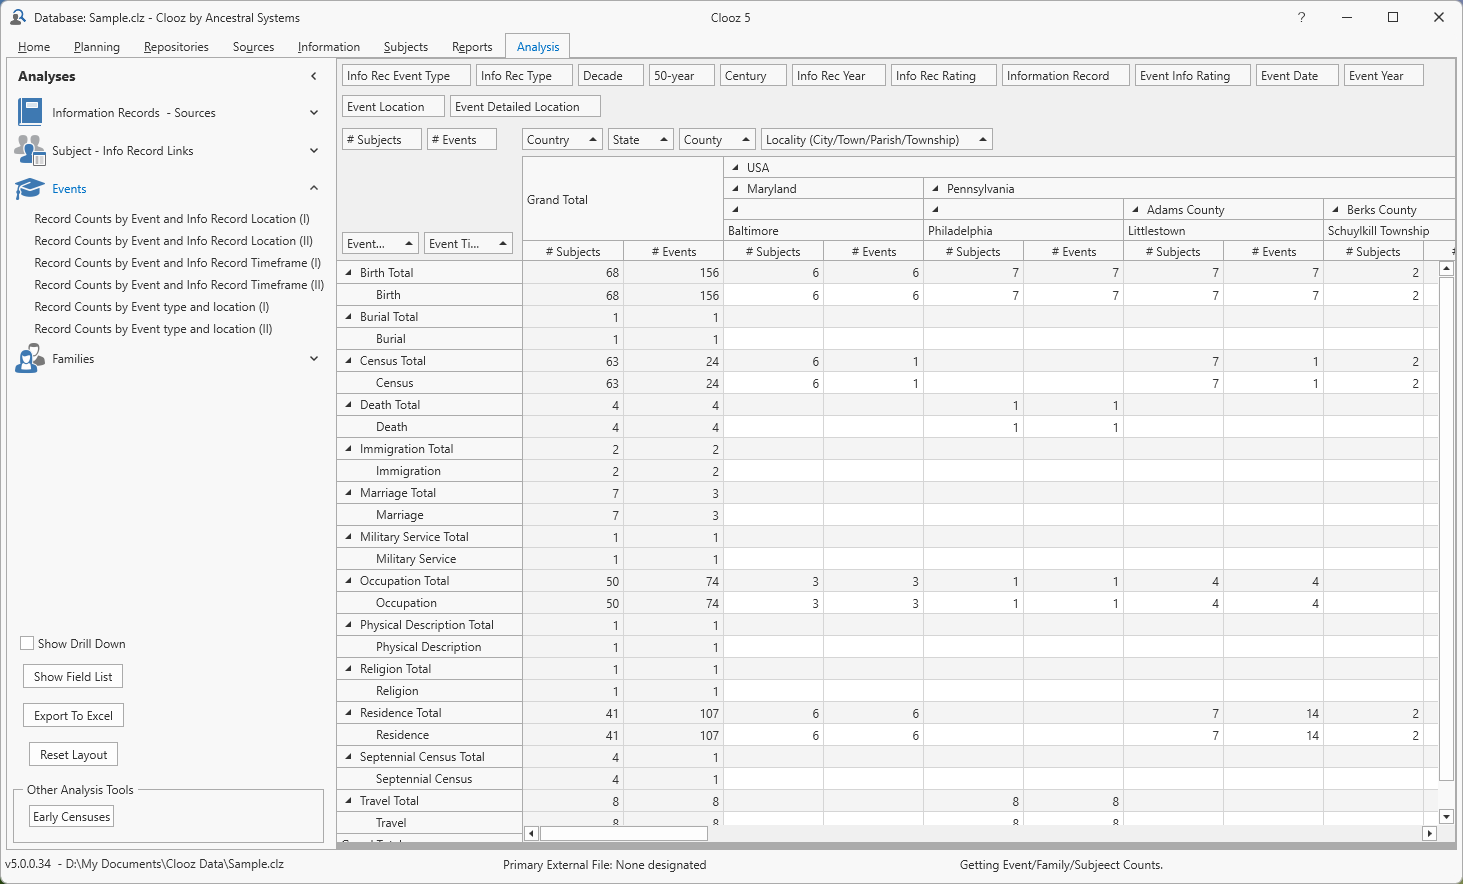
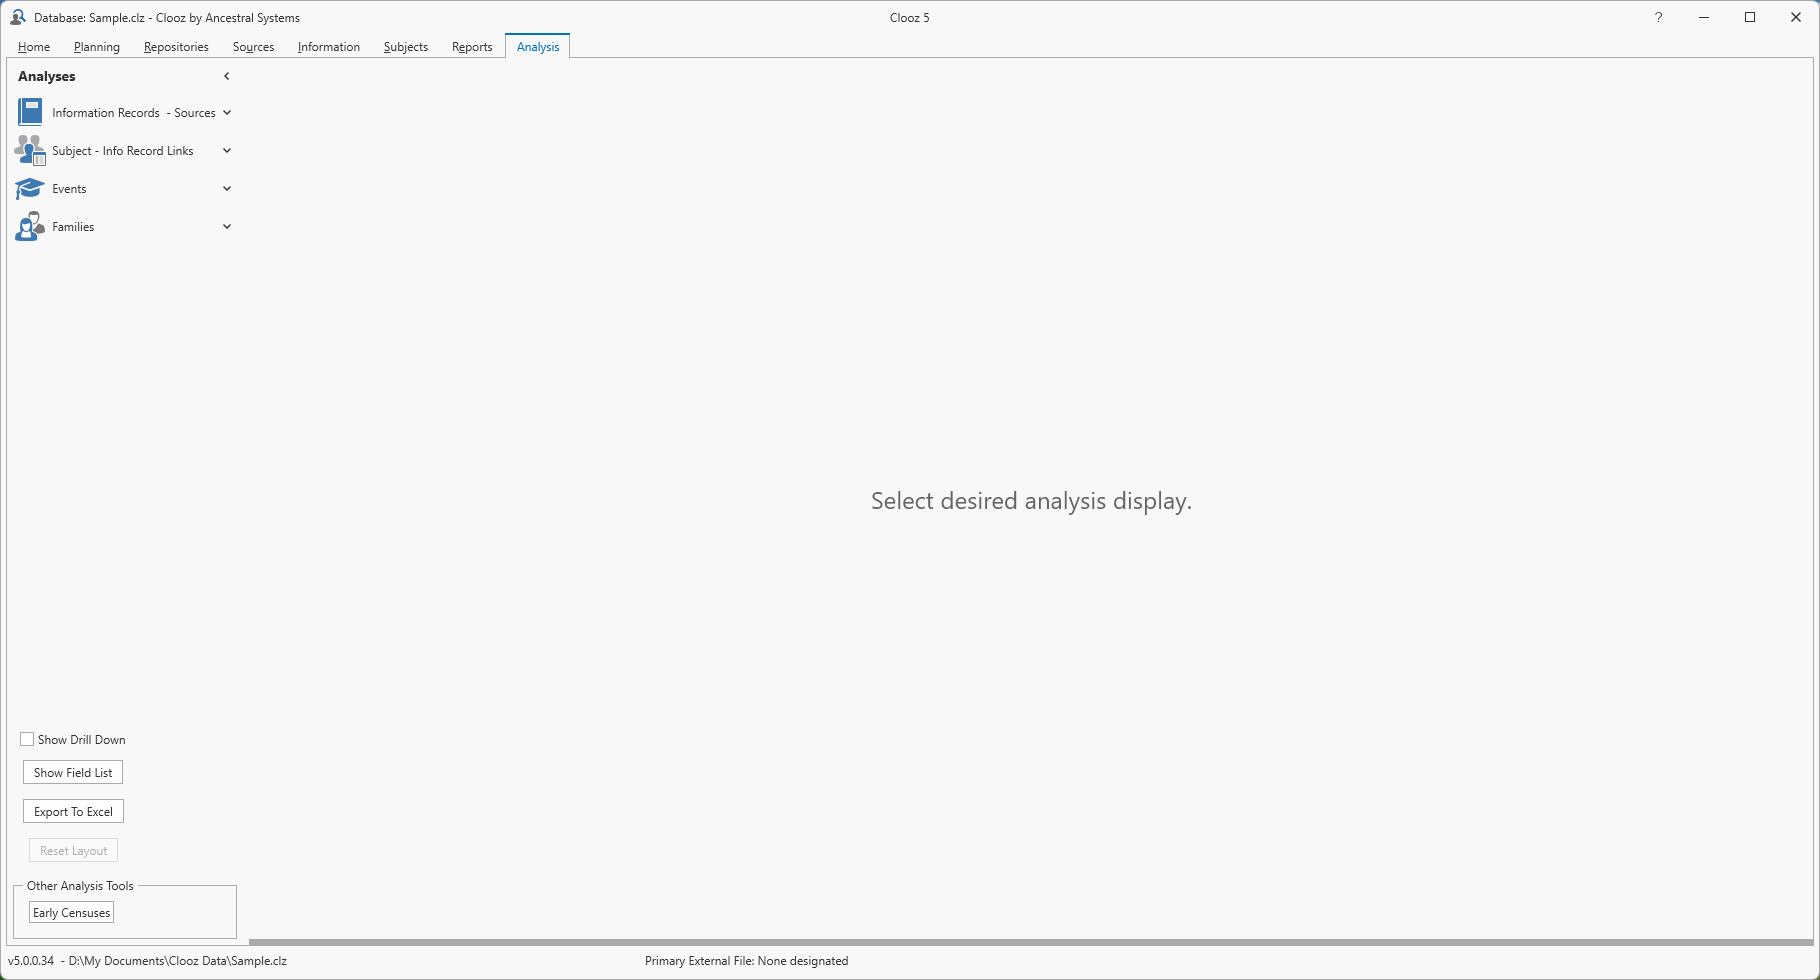 When you first open the Analysis Tab a grid area will be blank. Once you select a set of records to analyze, the main grid area will show record counts of a particular type (such as number of Subjects
![]() Subjects are the objects you are gathering information about such as people, buildings, ships, etc. In most cases within Clooz, the Subject will be a person. However, Clooz supports several other Subject types such as businesses, real estate/buildings, ships and artifacts.) associated with the particular row and column values. From there you can then double-click a cell to drill down into the data to see the records comprising that count. The first step though is defining the set of data you would like to work with.
Subjects are the objects you are gathering information about such as people, buildings, ships, etc. In most cases within Clooz, the Subject will be a person. However, Clooz supports several other Subject types such as businesses, real estate/buildings, ships and artifacts.) associated with the particular row and column values. From there you can then double-click a cell to drill down into the data to see the records comprising that count. The first step though is defining the set of data you would like to work with.
Specific instructions on using the various capabilities of this analysis tool are presented in the following topics: